 NoNoise
NoNoise
NoNoise
Track habits with beautiful calendar views, heat maps, and progress graphs. See patterns instantly and build unstoppable momentum.
Your brain processes visual information 60,000 times faster than text. When you see your habits instead of just listing them, something remarkable happens: patterns emerge, motivation increases, and consistency becomes self-reinforcing.
The science: Visual progress triggers the brain's reward system more effectively than abstract data. A calendar full of check marks activates the same neural pathways as achieving the habit itself—creating positive reinforcement loops.
Comedian Jerry Seinfeld famously used a simple visual technique to write jokes daily:
Why this works: The visual chain becomes its own motivator. You don't want to see a gap. The longer the chain, the more you're invested in maintaining it. Loss aversion (not wanting to lose your streak) becomes stronger than the initial motivation.
Without visualization: "I should exercise today."
With visualization: "I have a 28-day streak. I'm not going to break it now."
The identity shifts from someone who tries to exercise to someone who exercises consistently.
See the entire month at once. Completed days are marked, creating a visual pattern. Great for: Understanding weekly rhythms, noticing trends (do you always skip Mondays?), celebrating consistency.
Like GitHub's contribution graph—darker colors indicate more activity or higher completion rates. Great for: Tracking frequency, seeing improvement over time, identifying peak productivity periods.
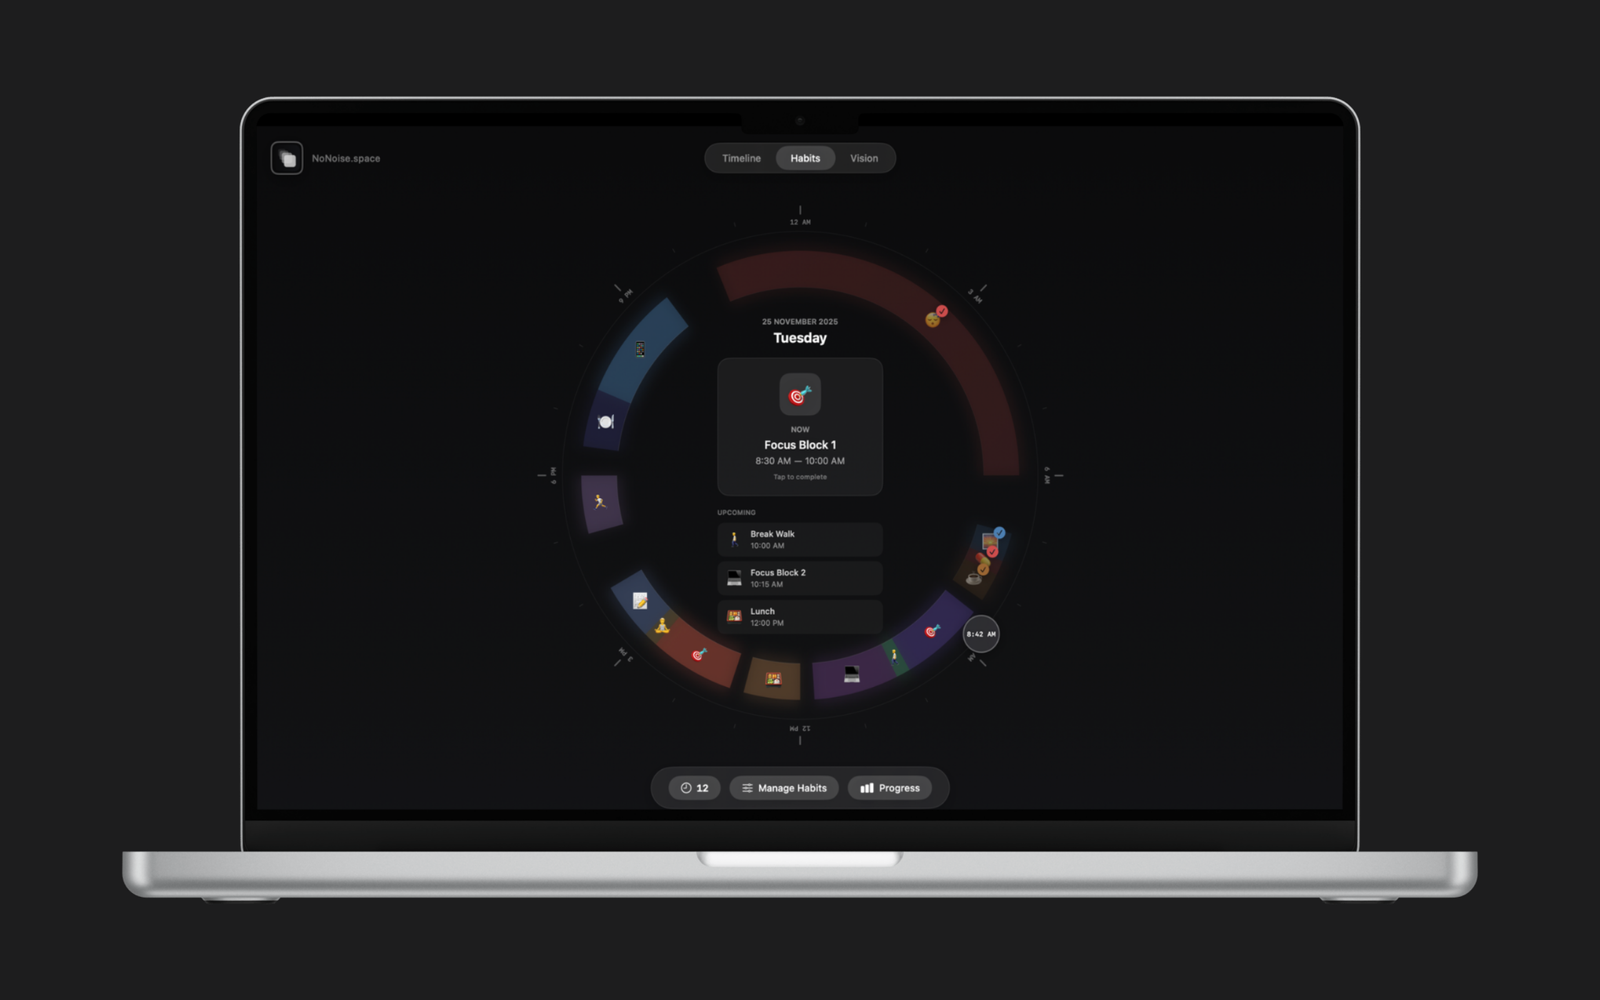
NoNoise's specialty—see your daily habits arranged in a clock. Great for: Time-based habits, routine visualization, understanding how habits connect throughout the day.
Simple number that goes up with each consecutive completion. Great for: Gamification, quick motivation check, long-term consistency goals.
Line or bar graphs showing completion rates over weeks/months. Great for: Analytical minds, long-term trend analysis, comparing multiple habits.
When you track habits visually over time, you discover patterns you'd never notice otherwise:
You might notice: Perfect compliance Monday-Thursday, total collapse Friday-Saturday, moderate Sunday. This reveals the habit isn't the problem—your weekend routine is. Solution: Design different weekend versions of the habit.
Visual tracking shows: Days you meditate, you also exercise. Days you skip one, you skip both. Insight: These habits are linked. Protect the keystone (meditation) to maintain the chain.
Some people notice: First week of the month is strong, third week crashes. Could be: paycheck cycle, energy patterns, work deadlines, or biological rhythms. Adjust expectations and strategies for "weak" weeks.
Morning habits: 90% completion rate. Evening habits: 40% completion rate. Solution: Move evening habits to morning, or create environmental triggers that don't rely on willpower.
Visual view shows: You didn't suddenly stop—the habit gradually shifted 30 minutes later each week until it disappeared. Solution: Track time as well as completion, reset drift immediately.
Lag measures: Did I do it? (binary yes/no)
Lead measures: How did it feel? Quality? Duration?
Track both. Sometimes you maintain the streak but quality drops—the visual data won't show this unless you track it separately.
The power of visual tracking isn't just analysis—it's the feedback loop:
Complete habit → feel briefly good → forget → repeat tomorrow (maybe)
Complete habit → mark it visually → see progress → dopamine hit → reinforcement → excited for tomorrow
The visual mark isn't just record-keeping—it's part of the reward.
Different colors for different categories:
At a glance, you see: "I'm crushing physical health but neglecting relationships."
Instead of binary done/not done, track three states:
Why this helps: Perfectionism kills habits. "I only had time for 10 minutes, so I'll skip it entirely." Wrong. 10 minutes maintains the chain and the identity.
Add tags or notes to visual tracking:
After months, you'll see: "I maintain habits 95% of normal days, 60% when traveling, 30% when sick." Adjust expectations accordingly.
Popularized by habit tracking apps—each day is one pixel in a larger pattern. From far away, you see the shape of your year:
For physical habits (exercise, organization, creative projects), visual tracking should include visual results:
Seeing real-world results amplifies the data's motivational power.
Most habits have delayed results. You don't see fitness results for weeks. This is where visual tracking saves you—it provides immediate feedback (the marked calendar) while you wait for long-term results.
Tracking 20 habits simultaneously creates visual overwhelm. Your calendar becomes a confusing mess. Solution: Focus on 3-5 core habits. Master those, then add more.
You track diligently but never look at the big picture. Solution: Weekly review (analyze the past week), monthly review (spot patterns, adjust strategy), yearly review (see long-term trends).
You get sick, life happens, streak breaks, you abandon the entire system. Solution: Streaks are motivational tools, not moral judgments. Missing one day is fine. Just restart immediately.
You track what's easy to measure, not what matters. 100-day streak of "checking habit tracker" means nothing if the underlying behavior hasn't changed. Solution: Track outcomes and behaviors, not just activity.
Most habit trackers require manual input, separate calendar views, and mental effort to see patterns. NoNoise integrates:
The result: You spend less time managing the system and more time doing the habits.
Visual tracking that reveals patterns, motivates action, and makes consistency feel effortless. Start building unstoppable chains today.
Download NoNoise for MacVisualize your progress